About
SAVA: A Signal Acquisition, Visualization & Analysis software
Signals, as in analog sensor data
Acquisition, as in data sampling/capturing/recording
Visualization, as in plotting raw/processed data
Analysis, as in live/post data processing
The software is thought as a general purpose, easy to use, data processing/visualization tool. However with a machinery dynamics focus in the build in analysis types.
Capabilities
The software has build in support for National Instruments Daq equipment or it can load external source scripts, for customizable data sources (see Input Sources).
Recording and Playback happens via a custom/open Hdf5 file format, but multiple formats can be imported / exported (see File sources and File formats).
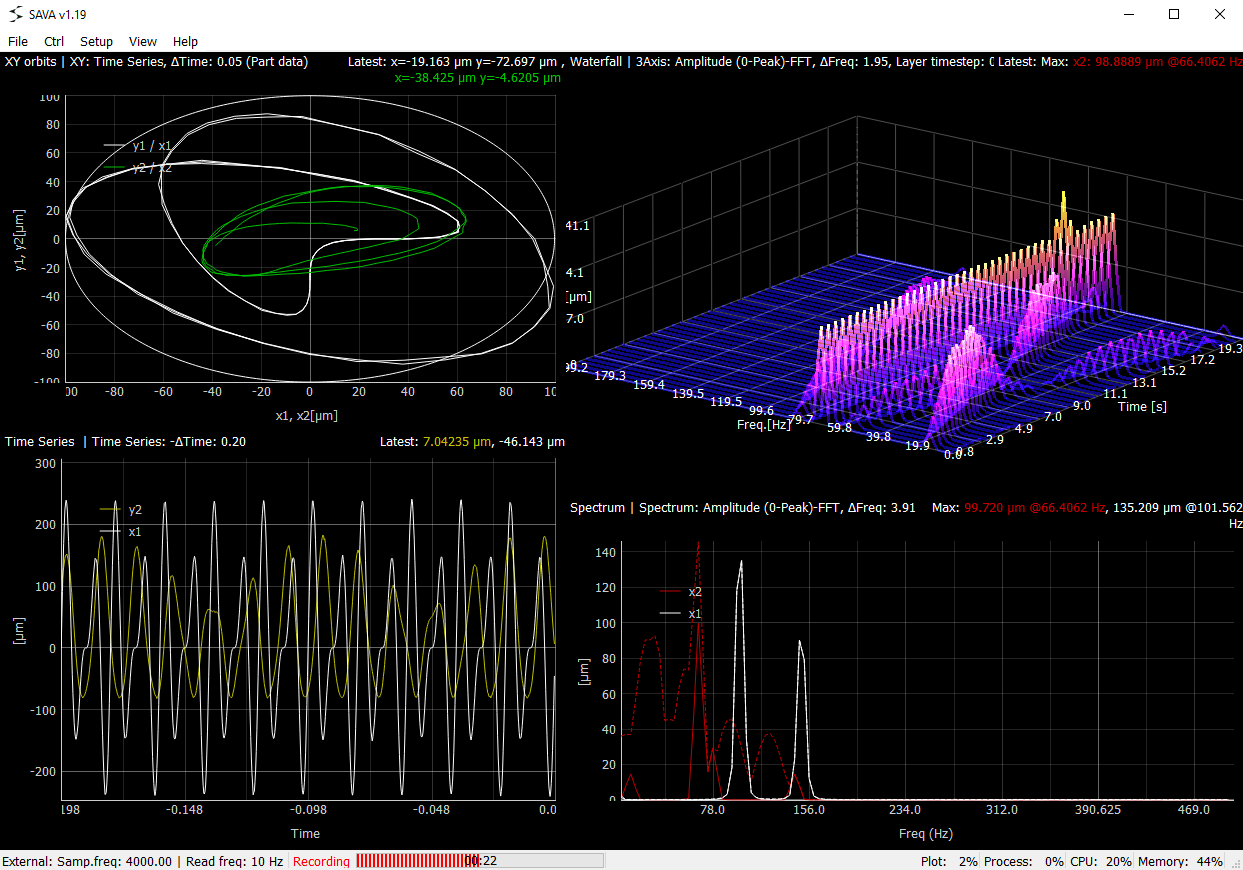
Raw and analysed data can be visualized and inspected in real-time or via playback (see Plots).

Example of the application