Application Layout
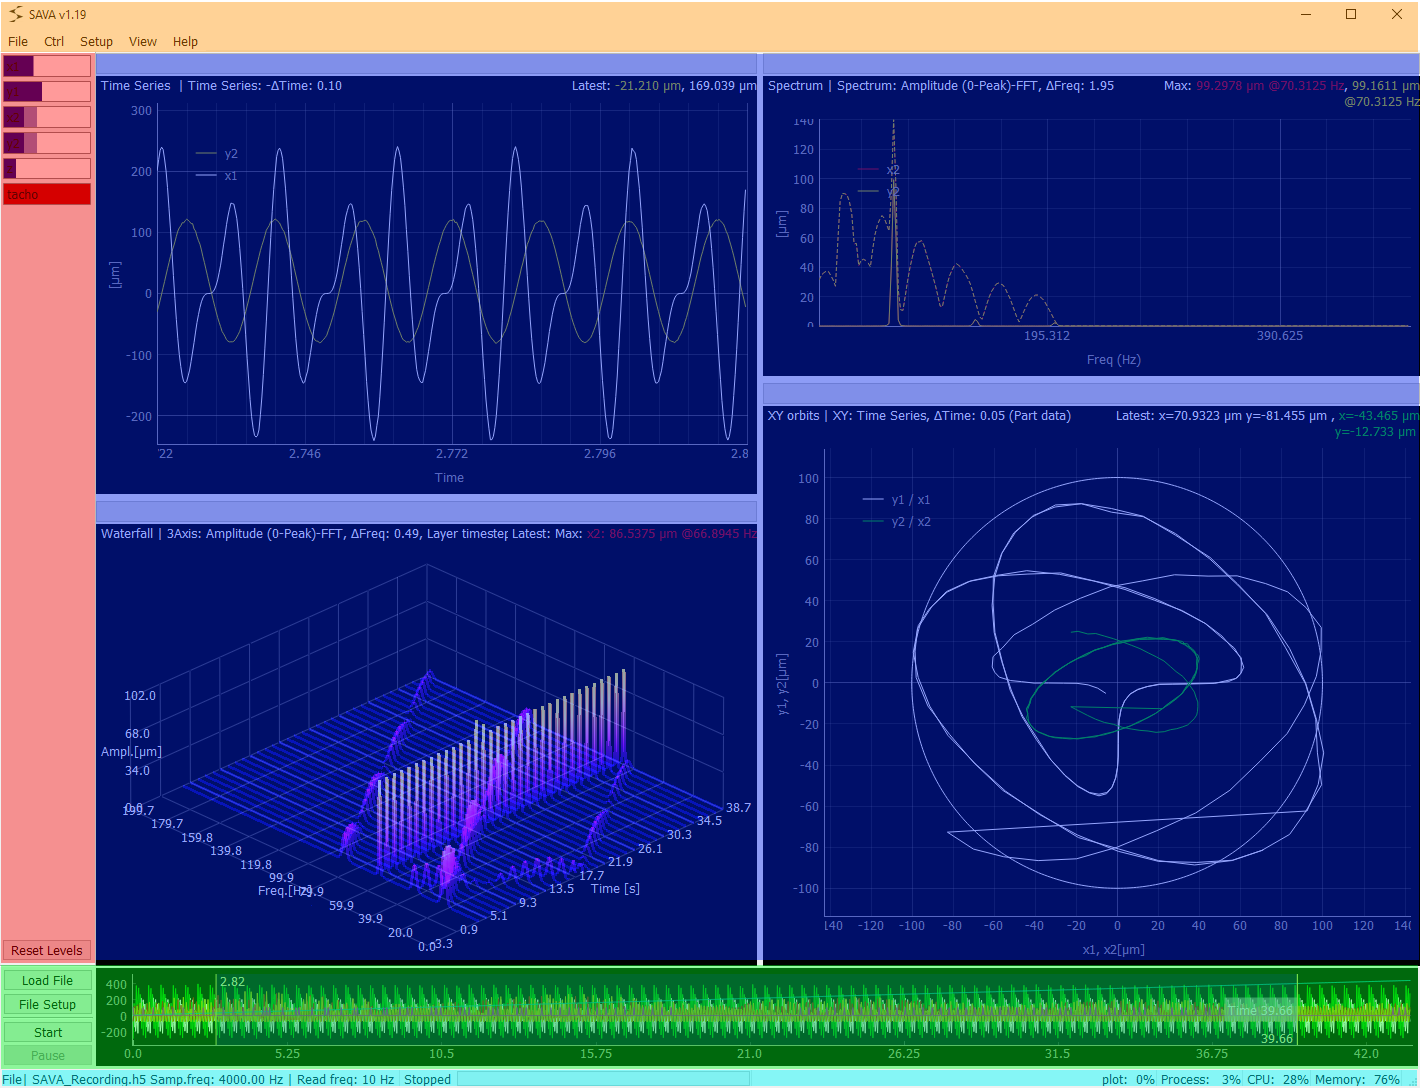
The application main window consists of the following elements.

Application layout
Level Indicator
The level indicator toolbar (highlighted in red) gives a live overview of the channels in the source. For each of the channels the current utilization of the range (log scale) is shown in dark blue and in the maximum level, since last start source, in light blue. If a channel have been overloaded (out of range value) the colors will change to dark/light red.
The maximum levels can be reset by pushing the “Reset levels” button at the bottom of the toolbar.
The toolbar can be shown/hidden via the menu “Setup”->”Level Indicator”
Plot Area
The plot area (highlighted in blue) is occupied by a plot container for each of the added plots in the Plots setup (four in this example). Each plot container can be manually resized and moved to a desired location. Resizing/moving is enabled via “View”->”Move/Resize plots”. The plot containers can be automatically resized (equally) and distributed by “View”->”Destribute plots” and specifying the number of columns to split the plot area into.
Plot Container
Besides the actual plot, the container features a plot name and plot type description in the top left corner.

Plot container example
In the top right corner data info is shown. The data info depends on the running state. In running state the most recent value or maximum value is shown, depending on the plot type. In paused/stopped state the cursor value is show.
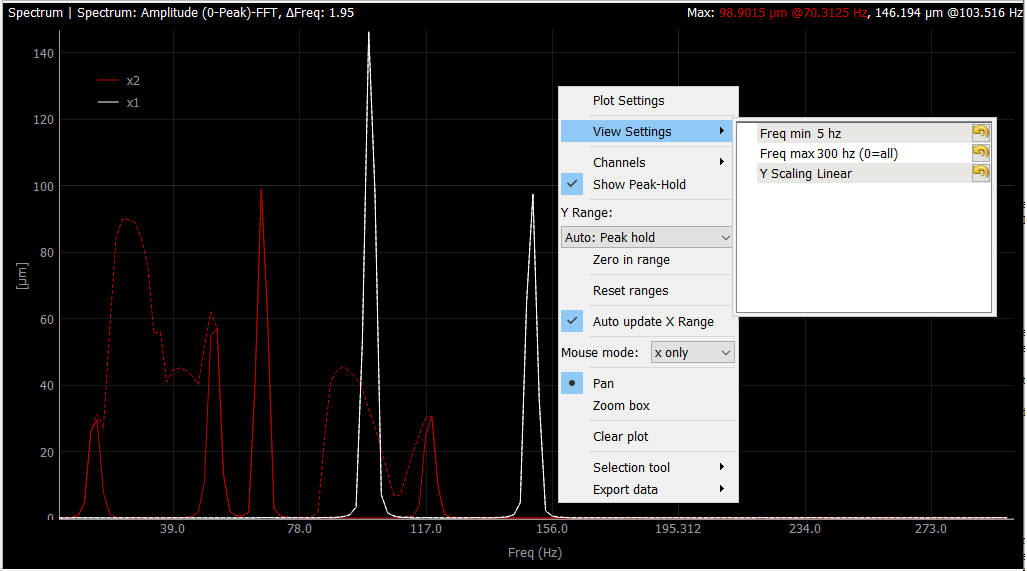
Plot context menu
The content of the context menu depends on the plot type. The options are:
Plot setup: Open setup for the individual plot
View settings: Modify view settings directly
Channels: Toggle channel visibility
Peah-hold: Show peak hold
Y-Range: Settings for the Y-Range scaling of the plot
X-Range: Settings for the X-Range scaling of the plot
Zero in range: Force the Y-Scaling to keep 0 in the range
Reset ranges: Resetting the peak scaling value
Auto X-Range: X-Range follows last value
Mouse mode: Direction(s) affected by mouse panning/zooming(scrolling)
Pan/Zoom box: Effect of mouse left click movement
Axis equal: Keep the X and Y scaling equal
Clear Plot: Clear the processed data
Selection Tool: Effect of cursor when pause/stopped
Export data: See exporting plot data
Maximizing plot
By double clicking plot, it can be maximized to take up either the whole plot area or the screen (depending on preferences setup). Return to normal view by double clicking a maximized container once more.
File Toolbar
The file toolbar (highlighted in green) only appears, when the source is set as File Source. The toolbar is used to give an overview of and navigate in recorded data files, see file source.
Status Line
The status line (highlighted in turquoise) shows, from left to right, info about:
The current source (Source type, Sampling frequency, Read frequency)
Status of the source (Stopped/Running/Recording)
Plot resource occupation (percentage of the plot resources occupied by updating the plots)
Process resource occupation (percentage of the process resources occupied by updating the processes)
Total CPU usage
Total Memory usage